

Learn how to read a bullish Nifty setup using trend, support, resistance, volume, moving averages, and risk management.
The Indian stock market rewards traders who understand trend, patience, and risk. When Nifty starts showing bullish technical strength, the goal is not to blindly buy every green candle. The goal is to read the structure, wait for confirmation, and manage downside risk.
This blog explains how traders can study a bullish Nifty setup using simple technical tools like support, resistance, moving averages, volume, and price action.
Nifty bullish technical setup chart
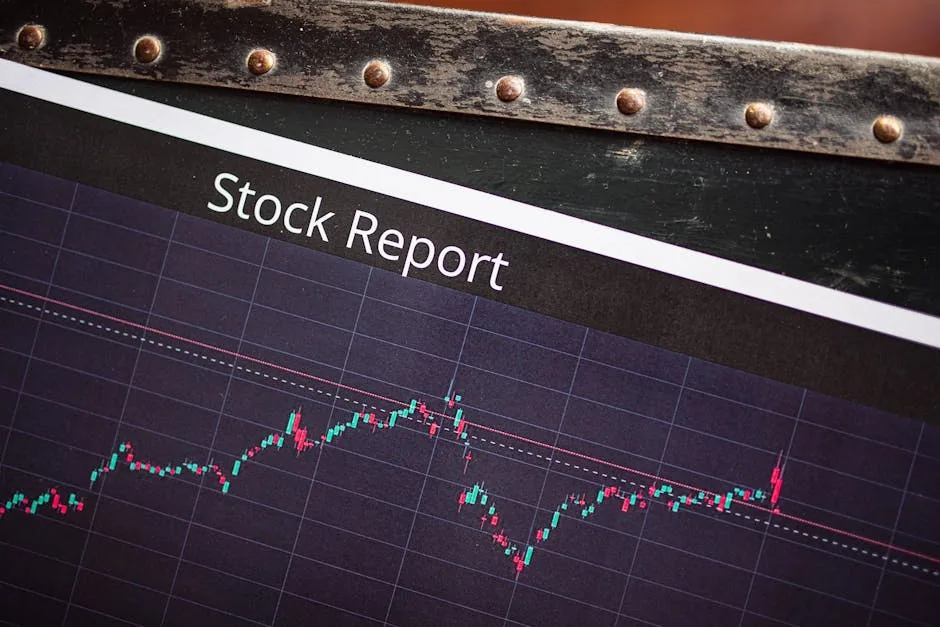
🚀 What Does a Bullish Nifty Setup Mean?
A bullish setup means the market structure is showing signs of strength. Buyers are active, dips are getting absorbed, and prices are moving toward higher resistance zones.
- ✅ Higher highs and higher lows are forming
- ✅ Nifty is sustaining above important moving averages
- ✅ Breakouts are supported by volume
- ✅ Market breadth is improving
- ✅ Sector rotation is supporting the index
A bullish market does not mean there will be no corrections. It means corrections may become buying opportunities if the trend remains intact.
📊 Key Technical Signals to Track
1. Price Above Moving Averages
One of the simplest bullish signals is when Nifty trades above its short-term and medium-term moving averages. Traders commonly watch the 20-day, 50-day, and 200-day moving averages.
- 20-DMA: Short-term trend strength
- 50-DMA: Medium-term direction
- 200-DMA: Long-term market structure
If Nifty sustains above these levels, the broader trend usually remains positive. A close below key moving averages can weaken the setup.
2. Support and Resistance Zones
Support is the price zone where buyers usually enter. Resistance is the zone where sellers may become active. In a bullish setup, old resistance often becomes new support.
- Mark recent swing highs as resistance.
- Mark recent swing lows as support.
- Watch whether Nifty holds above breakout levels.
- Avoid chasing if price is too far from support.
Nifty support and resistance zone example

🔥 Bullish Breakout Checklist
Before calling any move a breakout, traders should check whether the move has real strength.
- 📌 Price closes above resistance
- 📌 Volume expands during breakout
- 📌 Breakout candle has strong body
- 📌 Breakout retest holds above the zone
- 📌 Broader market participation improves
A breakout without volume can fail quickly. A breakout followed by a successful retest is usually stronger than a sudden vertical move.
🏦 Sectors That Often Lead Bullish Nifty Moves
Nifty strength usually becomes more reliable when heavyweight sectors participate. Traders should track sector performance instead of looking only at the index.
- 🏦 Banking and financial services
- 💻 Information technology
- 🚗 Auto stocks
- ⚡ Energy and power stocks
- 🏗️ Infrastructure and capital goods
- 💊 Pharma and healthcare
If Nifty is rising but only a few stocks are supporting the move, traders should stay cautious. A healthy rally usually has wider sector participation.
🧠 Trader Psychology in a Bullish Market
A bullish market creates excitement, but excitement can damage discipline. Many traders enter late, increase position size, ignore stop-losses, and convert short-term trades into emotional holdings.
Professional traders avoid emotional decisions. They plan entries, exits, risk, and invalidation levels before entering the trade.
The best bullish trade is not the one that looks exciting. It is the one where risk is clearly defined.
⚠️ Common Mistakes to Avoid
- ❌ Buying after a big rally without waiting for a pullback
- ❌ Ignoring stop-loss because the market looks strong
- ❌ Trading every breakout without checking volume
- ❌ Entering based only on social media tips
- ❌ Using full capital in one trade
- ❌ Holding losing trades without a plan
✅ Simple Risk Management Rules
Risk management is more important than prediction. Even a good technical setup can fail. Traders should protect capital first.
- Risk only a small percentage of capital per trade.
- Place stop-loss below the invalidation level.
- Do not average down blindly.
- Book partial profit near resistance zones.
- Trail stop-loss when the trade moves in your favor.
- Avoid overtrading during volatile sessions.
Risk management rules for Indian stock market traders
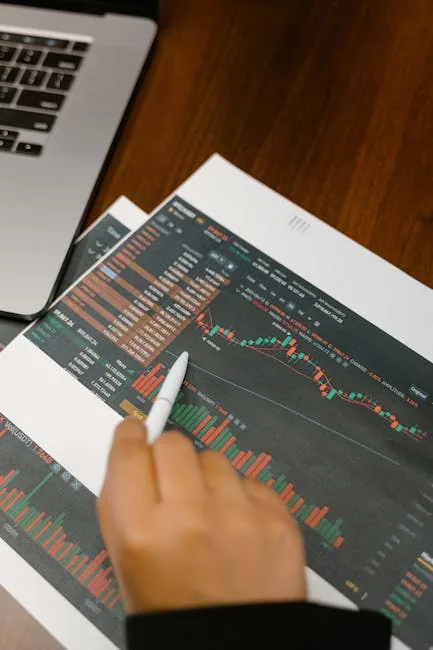
📌 Example Bullish Trading Plan
Here is a simple structure traders can use for educational purposes:
- Trend: Nifty should remain above key moving averages
- Entry: After breakout or successful retest
- Stop-loss: Below recent support or breakout zone
- Target: Next resistance zone
- Risk: Fixed before entering the trade
- Exit: If price closes below important support
📚 Final View
The Nifty bullish setup becomes stronger when price action, volume, moving averages, market breadth, and sector leadership align together.
Traders should avoid emotional entries and focus on clean setups with defined risk.
A disciplined trader does not need to predict every market move. The trader only needs a repeatable process, controlled risk, and patience.
📊 Sample Comparison Table: Bullish vs Weak Nifty Setup
| Factor | Bullish Setup | Weak Setup |
|---|---|---|
| Trend | Higher highs and higher lows | Lower highs and lower lows |
| Price Action | Price sustains above breakout zone | Price fails near resistance |
| Moving Averages | Nifty trades above 20-DMA and 50-DMA | Nifty slips below key moving averages |
| Volume | Breakout comes with strong volume | Breakout happens with low volume |
| Support Zone | Dips are bought near support | Support breaks repeatedly |
| Market Breadth | Many sectors participate | Rally depends on few stocks |
| Trader Action | Wait for breakout or retest | Avoid chasing; wait for clarity |
| Risk Control | Stop-loss placed below support | No clear invalidation level |
Disclaimer
This article is for educational purposes only. It is not investment advice, trading advice, or a recommendation to buy or sell any stock, index, futures, or options contract. Always consult a SEBI-registered financial advisor before making investment decisions.